サイトのPV数をARMAモデルで推定してみる
前回、電力量をARIMAモデルを使ってpythonで推定してみたいと意気込んでいたんですが、まずは基本となるARMAモデルを使ってみるべきだろうと思いまして検証してみました。ARMAモデルに使用できそうなデータを探していたところ、『とあるサイト』のPV数がちょうど良さそうでしたので、PV数をARMAモデルを使って推定してみます。
%pylab
import pandas as pd
import pandas_datareader.data as pdr
import numpy as np
import matplotlib.pyplot as plt
import statsmodels.api as sm
jbcpv = pd.read_csv("C:\\Users\jbc20170101-20170228.csv",skiprows=1, names=['Date', 'PV']).dropna()
tmd = pd.to_datetime(jbcpv['Date'])
jbcpv.index = tmd
del jbcpv["Date"]
jbcpv.plot()
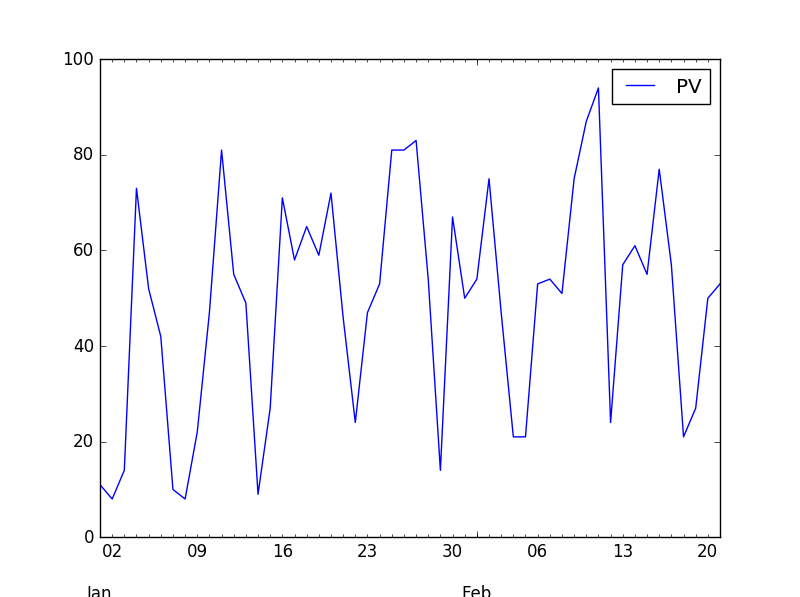
PV数のグラフです。『とあるサイト』というのはこのブログのことなんですけれど、
こうして見るとアクセス数はしょぼいですね。
plt.close()

fig = plt.figure(figsize=(8,6))
ax1 = fig.add_subplot(2,1,1)
fig = sm.graphics.tsa.plot_acf(jbcpv['PV'].squeeze(), lags=20, color='lightgray',ax=ax1)
ax2 = fig.add_subplot(2,1,2)
fig = sm.graphics.tsa.plot_pacf(jbcpv['PV'].squeeze(), lags=20, color='lightgray',ax=ax2)
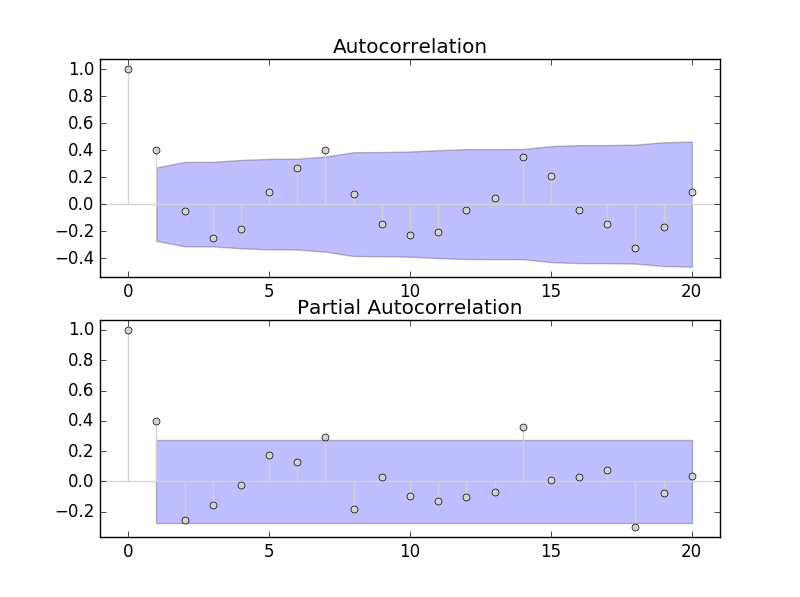
自己相関と偏自己相関です。自己相関と偏自己相関からARMAモデルを決めるのには
やり方があるみたいです。
モデル		| 自己相関関数	| 偏自己相関関数
---------------------------------------------------
AR(p)		| 徐々に消滅	| ラグp以降切断
MA(q)		| ラグq以降切断	| 徐々に消滅
ARMA(p,q)	| 徐々に消滅	| 徐々に消滅
■参考
https://www.i-juse.co.jp/statistics/jirei/sympo/10/arima-model.html
しかし、正直どう選択すればよいかわからないですね。
なので適当に怪しいものをいくつか選んでみました。(何か良いやり方はないんですかね)
plt.close()

arma_mod0001 = sm.tsa.ARMA(jbcpv['PV'], order=(0,1))
arma_mod0101 = sm.tsa.ARMA(jbcpv['PV'], order=(1,1))
arma_mod0100 = sm.tsa.ARMA(jbcpv['PV'], order=(1,0))
arma_mod0107 = sm.tsa.ARMA(jbcpv['PV'], order=(1,7))

arma_res0001 = arma_mod0001.fit(trend='nc',disp=-1)
arma_res0101 = arma_mod0101.fit(trend='nc',disp=-1)
arma_res0100 = arma_mod0100.fit(trend='nc',disp=-1)
arma_res0107 = arma_mod0107.fit(trend='nc',disp=-1)


arma_res0001.aic, arma_res0001.bic
Out[8]: (522.5572544975417, 526.45974193470465)

arma_res0101.aic, arma_res0101.bic
Out[9]: (484.5235209007709, 490.3772520565152)

arma_res0100.aic, arma_res0100.bic
Out[10]: (485.7470013509096, 489.64948878807246)

arma_res0107.aic, arma_res0107.bic
Out[11]: (481.1582243120612, 498.71941777929402)
AICとBICが最小になるものを選ぶようですが、今回はAICが一番最小だったarma_res0107を選んでみました。
print(arma_res0107.summary()) #reportで出力

                              ARMA Model Results
==============================================================================
Dep. Variable:                     PV   No. Observations:                   52
Model:                     ARMA(1, 7)   Log Likelihood                -231.579
Method:                       css-mle   S.D. of innovations             19.414
Date:                Thu, 02 Mar 2017   AIC                            481.158
Time:                        22:20:50   BIC                            498.719
Sample:                    01-01-2017   HQIC                           487.891
                         - 02-21-2017
==============================================================================
                 coef    std err          z      P>|z|      [0.025      0.975]
------------------------------------------------------------------------------
ar.L1.PV       0.9883      0.015     67.049      0.000       0.959       1.017
ma.L1.PV      -0.4419      0.117     -3.792      0.000      -0.670      -0.213
ma.L2.PV      -0.4104      0.144     -2.860      0.006      -0.692      -0.129
ma.L3.PV      -0.1250      0.157     -0.799      0.429      -0.432       0.182
ma.L4.PV      -0.2472      0.175     -1.415      0.164      -0.589       0.095
ma.L5.PV       0.1288      0.163      0.789      0.435      -0.191       0.449
ma.L6.PV       0.1415      0.126      1.126      0.266      -0.105       0.388
ma.L7.PV       0.3220      0.134      2.410      0.020       0.060       0.584
                                    Roots
=============================================================================
                 Real           Imaginary           Modulus         Frequency
-----------------------------------------------------------------------------
AR.1            1.0118           +0.0000j            1.0118            0.0000
MA.1            0.9712           -0.2382j            1.0000           -0.0383
MA.2            0.9712           +0.2382j            1.0000            0.0383
MA.3            0.2127           -1.2002j            1.2189           -0.2221
MA.4            0.2127           +1.2002j            1.2189            0.2221
MA.5           -1.1392           -0.0000j            1.1392           -0.5000
MA.6           -0.8341           -1.0674j            1.3547           -0.3556
MA.7           -0.8341           +1.0674j            1.3547            0.3556
-----------------------------------------------------------------------------
これをみてもよくわかりませんね。
つぎに、モデルの妥当性を検討してみます。
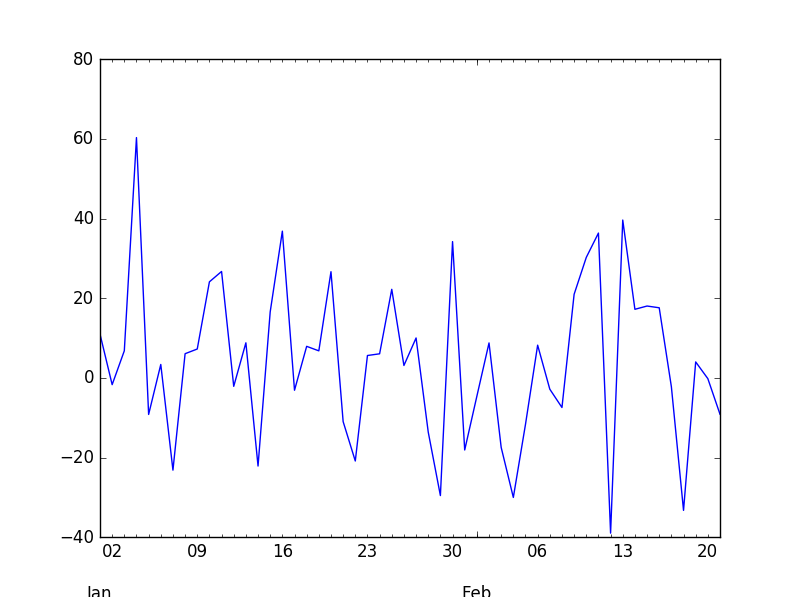
まず残差の確認をしてみます。
resid = arma_res0107.resid
resid.plot()
差が少なければいいらしいですが、これも良いのか悪いのか、よくわかりませんね。
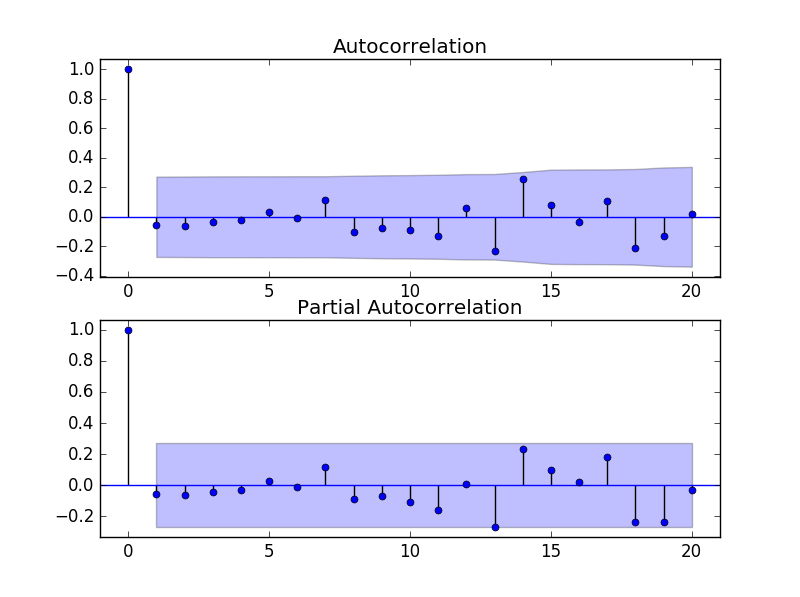
つづきまして残差の自己相関と偏自己相関を調べてみます。
plt.close()
fig = plt.figure(figsize=(8,6))
ax1 = fig.add_subplot(211)
fig = sm.graphics.tsa.plot_acf(resid.values.squeeze(), lags=20, ax=ax1)
ax2 = fig.add_subplot(212)
fig = sm.graphics.tsa.plot_pacf(resid, lags=20, ax=ax2)
fig.show()
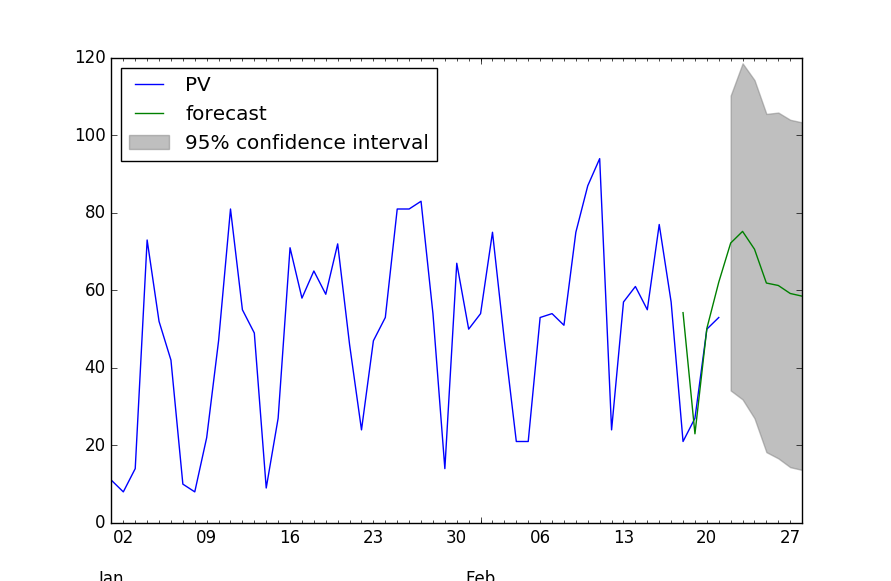
では予測をグラフにしてみます。
plt.close()

fig, ax = plt.subplots()
ax = jbcpv.ix['2017-01-01':].plot(ax=ax)
arma_res0107.plot_predict('2017/2/18', '2017/2/28', dynamic=False, ax=ax,plot_insample=False)
おお!なんかそれっぽいグラフができました!自分としてはイイ感じに思えるのですけれど、どうなんでしょうか?その道のプロの人からすると、全然ダメとかあるのでしょうかね?まーでも、視覚的にみると面白いですね。時系列データはネット上から取得できるので、今後もいろいろ試してみたいと思います。
■参考
時系列分析II―ARMAモデル(自己回帰移動平均モデル)の評価と将来予測
http://www.atmarkit.co.jp/ait/articles/1409/01/news006.html
Autoregressive Moving Average (ARMA): Sunspots data
http://statsmodels.sourceforge.net/devel/examples/notebooks/generated/tsa_arma_0.html
関連する投稿:
- 2017-03-17:SARIMAXモデルでPVを予測してみる
- 2017-03-25:SARIMAX vs. Random Forest Regression -ブログのセッション数の予測-
- 2017-02-24:電力データから季節変動の分解
- 2017-03-14:季節調整済みARIMAモデルで電力使用状況を推定してみる part2 予測表示
- 2014-08-23:Pythonで回帰分析 (身長と体重の関係、PVとセッションの関係)
“サイトのPV数をARMAモデルで推定してみる” への1件の返信